C
E
Picor Corporation ?picorpower.com
QPI-8
Rev 1.5, Page 10 of 17
QPI-8
QUIETPOWER
?/DIV>
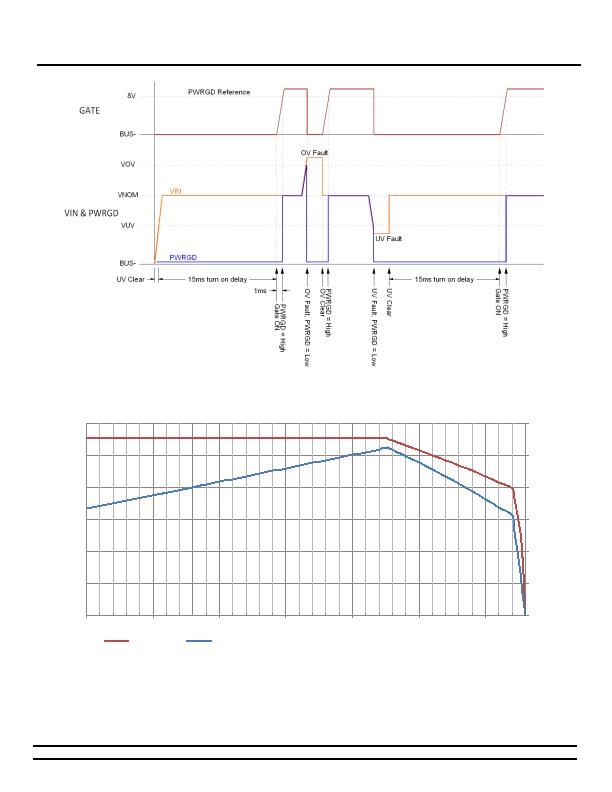
Figure 18 QPI-8 UV and OV fault timing diagram.
Current De-Rating: mounted to QPI-8-EVAL1 evaluation board.
Figure 19 - Current de-rating and power dissipation over ambient temperature range.
The de-rating curve in Figure 19 is based on the maximum
allowable internal component temperature and the 5.5A
maximum rating of the QPI-8. The power dissipation curve is
based on the current squared multiplied by the internal
resistance between the inputs and outputs of the filter. The
internal resistance value is temperature compensated for the
power dissipation curve. The left axis (current) is in amps for
the solid trace, the right axis (power) is in watts for the
dashed trace.
0.0
0.3
0.6
0.9
1.2
1.5
1.8
0
1
2
3
4
5
6
-40
-15
10
35
60
85
110
Ambient Temperature (癈)
QPI-8 Current
QPI-8 Power Dissi ation
发布紧急采购,3分钟左右您将得到回复。
相关PDF资料
SA56004HD,118
IC TEMP SENSOR DIGITAL 8SOIC
SC2463TSTRT
IC REG QD BCK/LINEAR 28TSSOP
SC338AIMSTRT
IC REG CTRLR DUAL POS ADJ 10MSOP
SC402BMLTRT
IC REG DL BCK/LINEAR SYNC 32MLPQ
SC403MLTRT
IC REG DL BCK/LINEAR SYNC 32MLPQ
SC418ULTRT
IC REG DL BUCK/LINEAR 20MLPQ
SC424MLTRT
IC REG DL BUCK/LINEAR 28MLPQ
SC4250LISTRT
IC HOT SWAP CTRLR 8-SOIC
相关代理商/技术参数
QPI-9
制造商:VICOR 制造商全称:Vicor Corporation 功能描述:Hot-Swap SiP With VI Chip EMI Filter
QPI-9-CB1
制造商:Vicor Corporation 功能描述:QPI-9LZ Filter w/ Hot-Swap Carrier Board for 24 V VI Chip "-CB" Boards up to 6A
QPI-9L
制造商:VICOR 制造商全称:Vicor Corporation 功能描述:VI Chip Input EMI Filters
QPI-9LZ
制造商:VICOR 制造商全称:Vicor Corporation 功能描述:Hot-Swap SiP With VI Chip EMI Filter
QPI-9LZ-01
制造商:VICOR 制造商全称:Vicor Corporation 功能描述:Hot-Swap SiP With VI Chip EMI Filter
QPI-X-EVAL1
制造商:VICOR 制造商全称:Vicor Corporation 功能描述:Evaluation Board for Active EMI Filters
QPL10000-M
制造商:Tamura Corporation of America 功能描述:
QPL10000-M-0
制造商:Tamura Corporation of America 功能描述:
